Dashboards
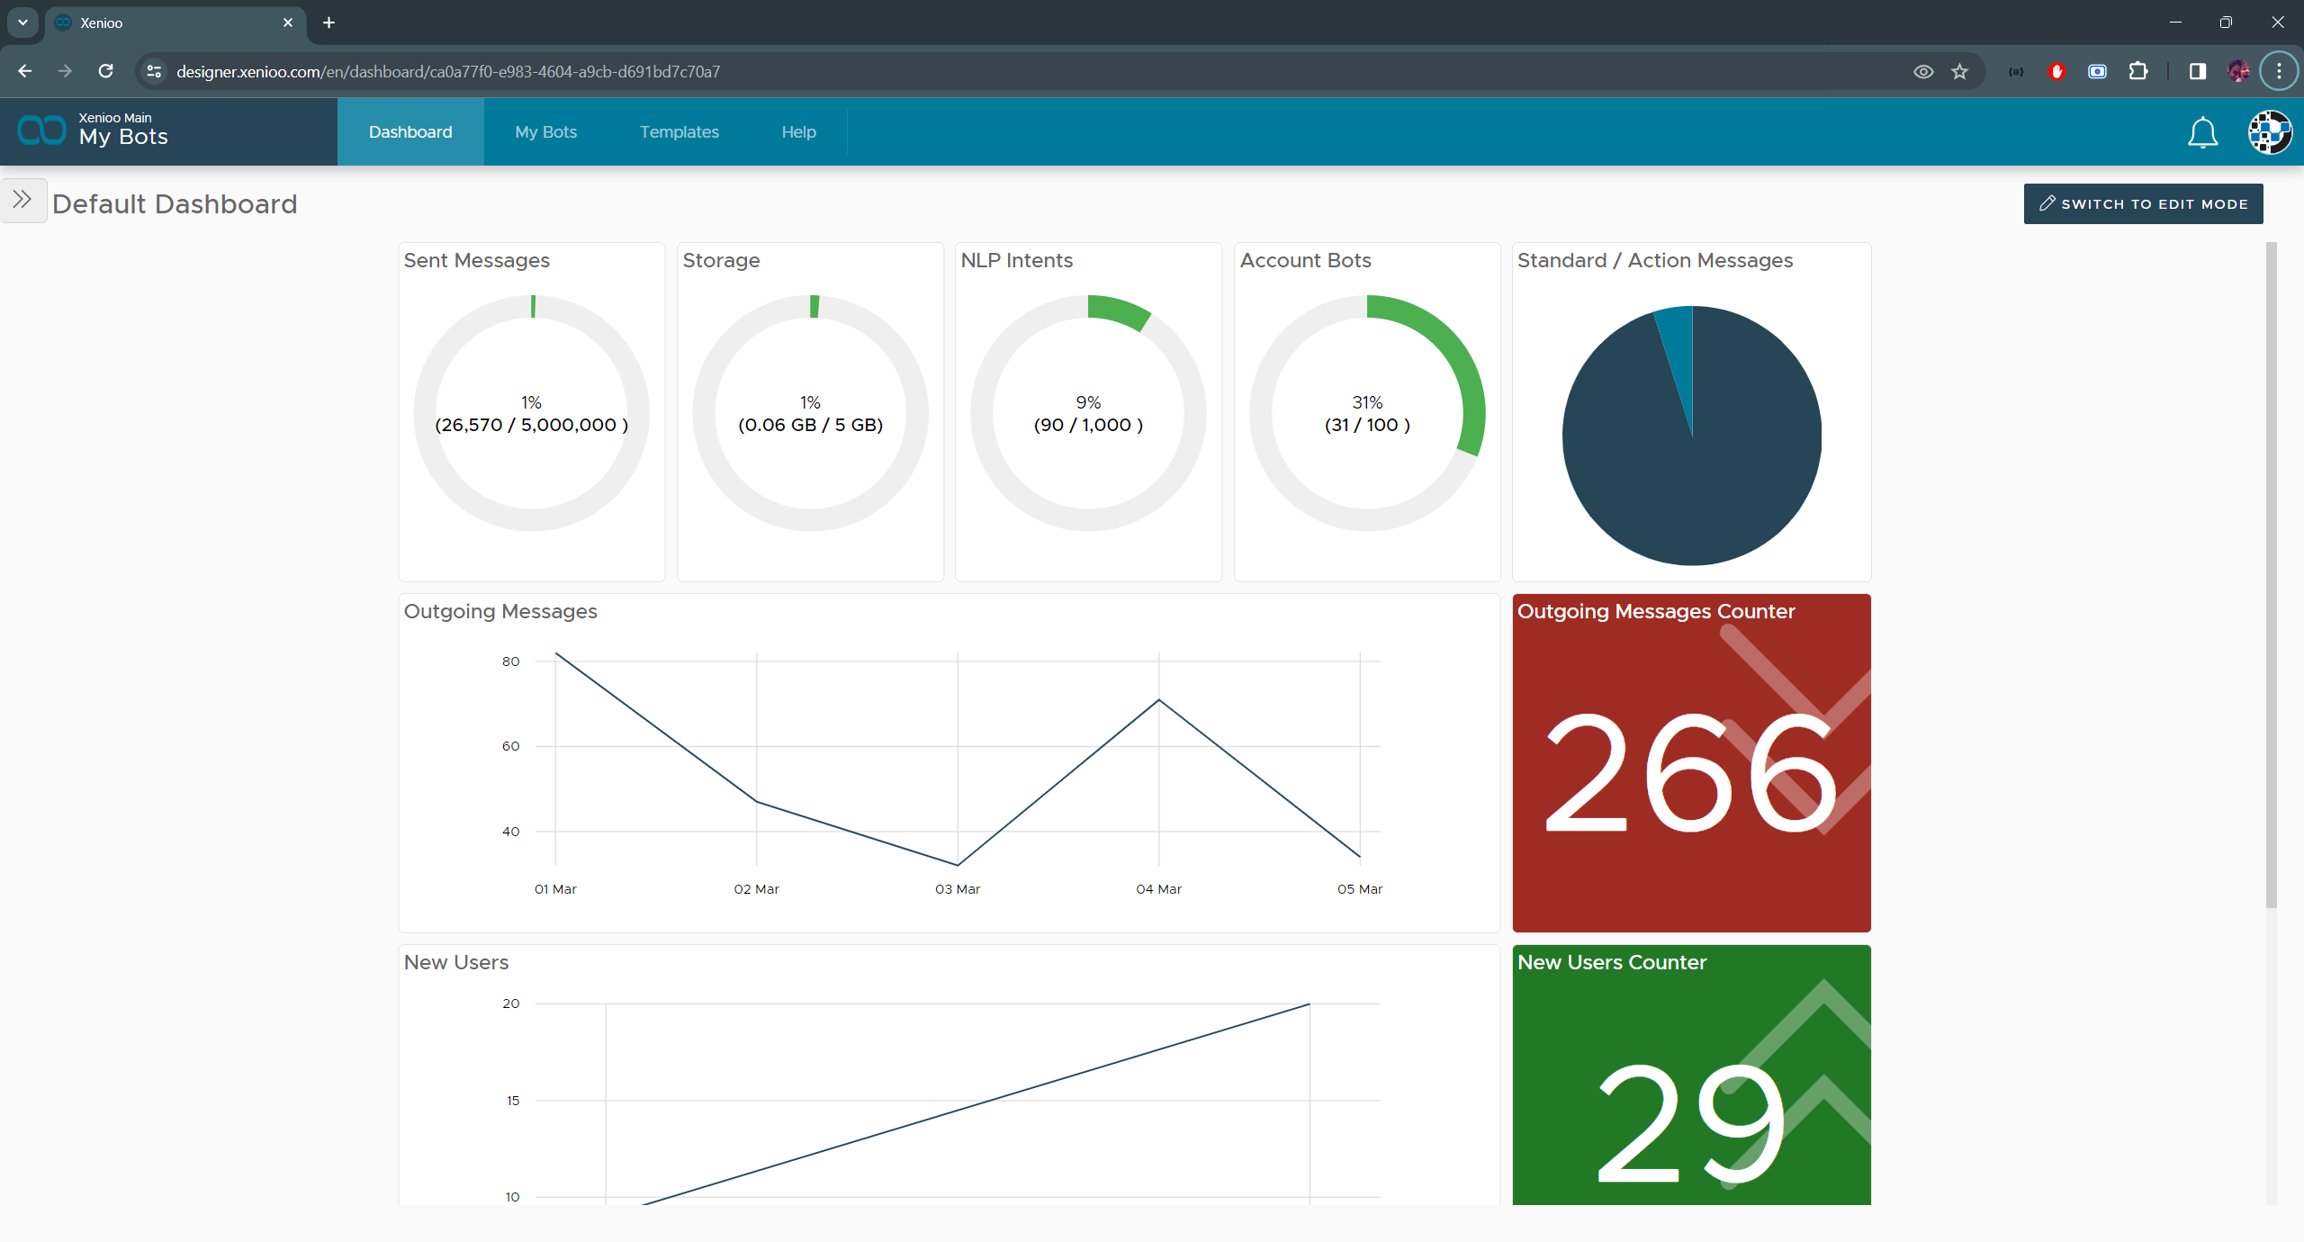
MyLINK Connect dashboards section will display a number of analytics information about your bots performance and status. The data displayed here is automatically updated by MyLINK Connect based on the different events that your bot generates.

Customizing your Dashboard
By default, MyLINK Connect will create a dashboard with a number of ready made widgets with the most common filters and data.
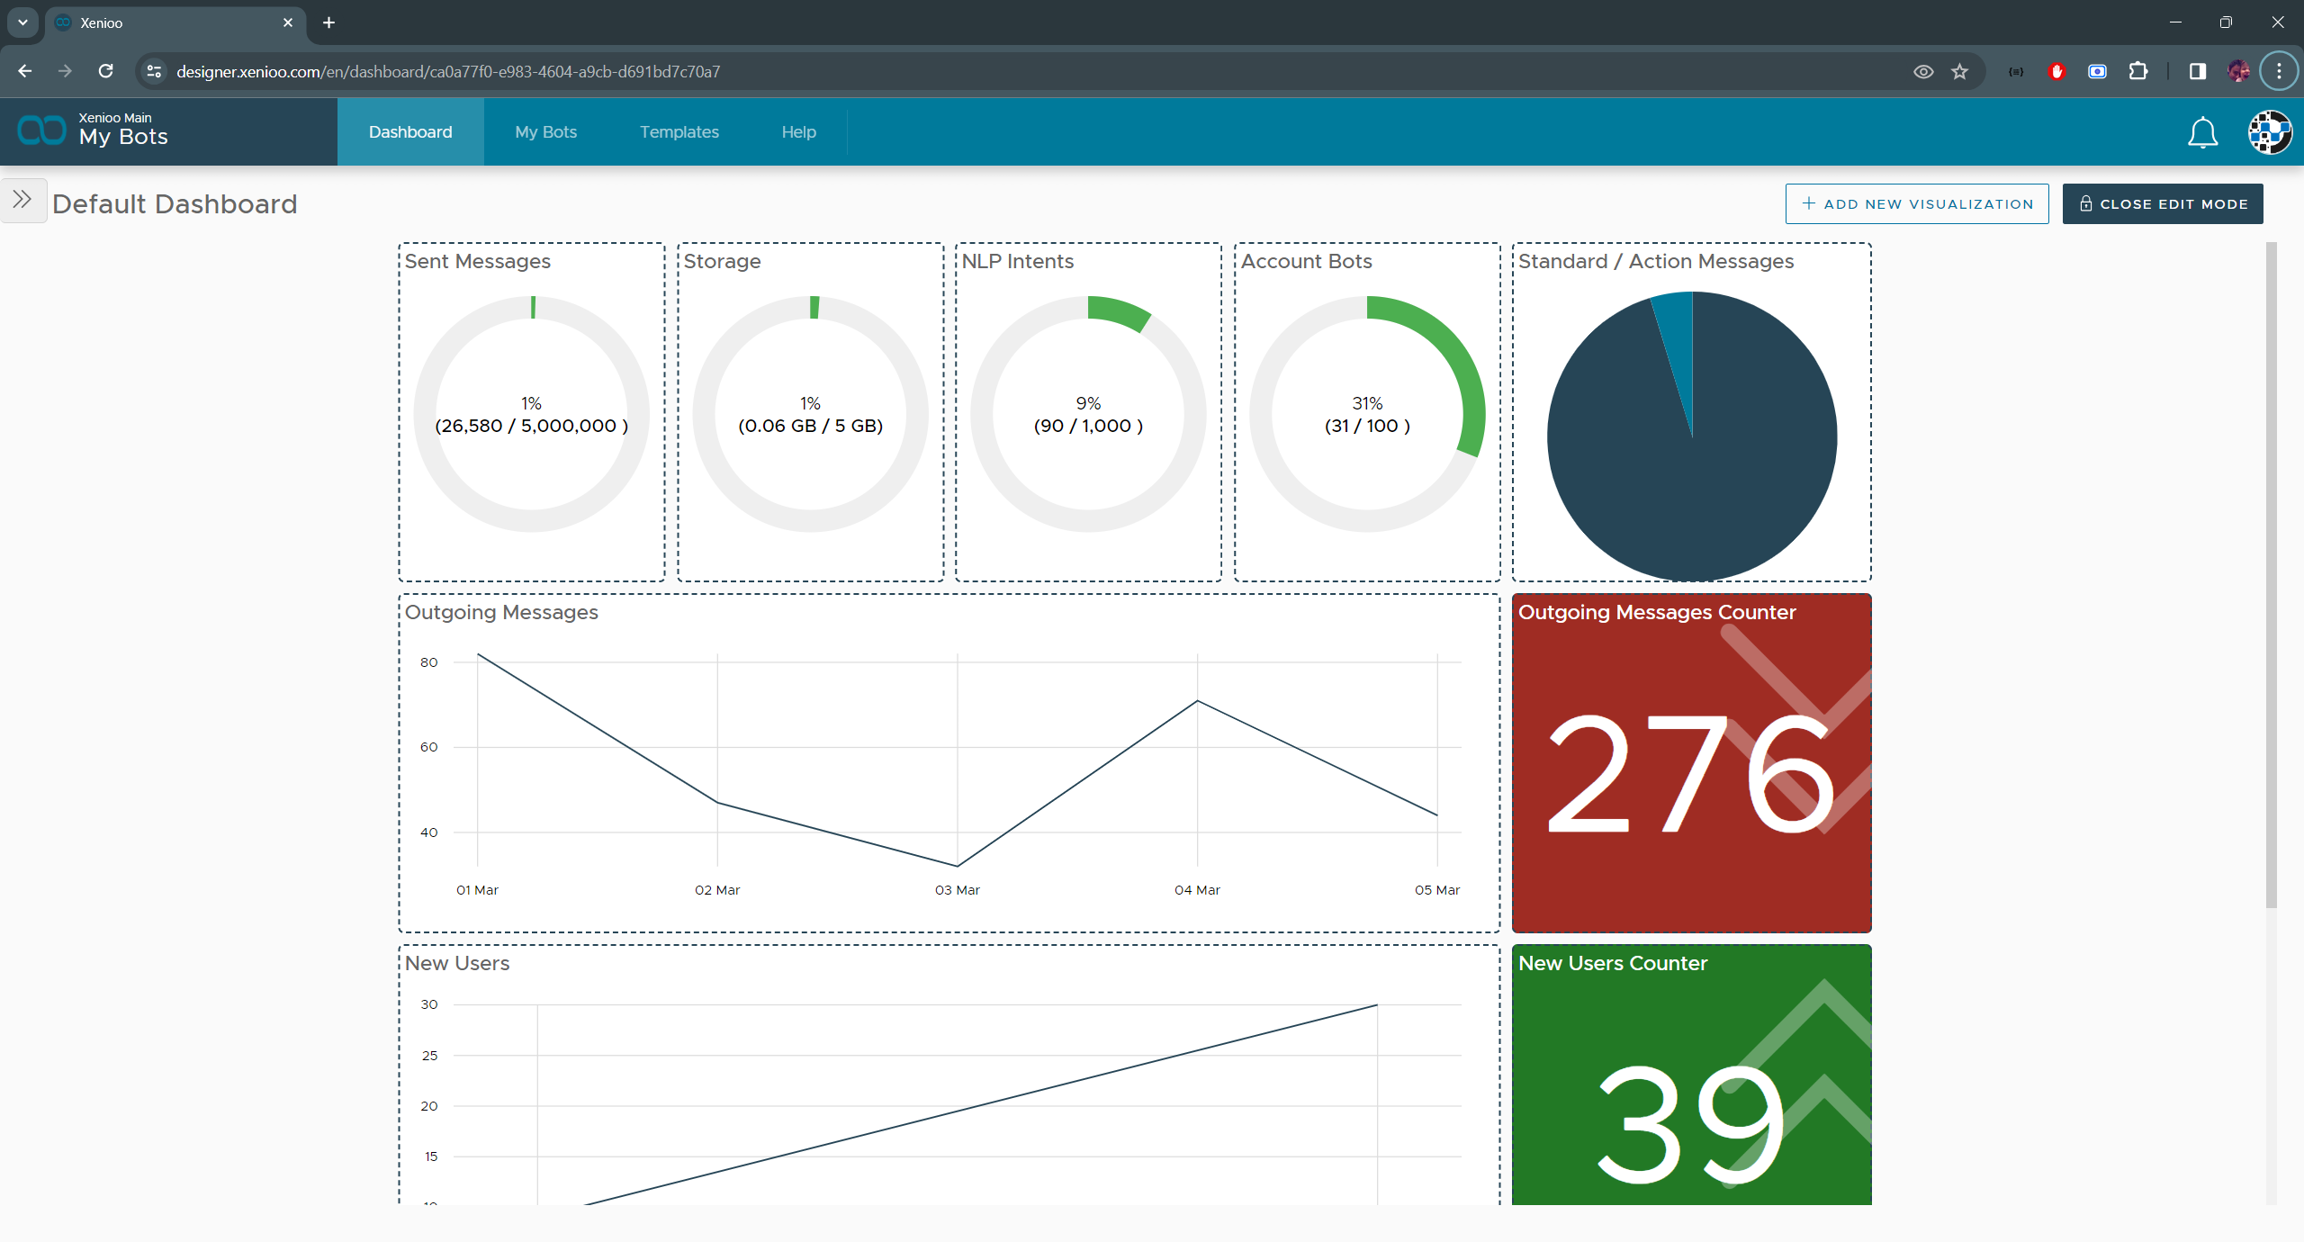
If your plan allows you to customize dashboards you will notice a button on the top right corner of the screen named "Switch to Edit Mode". Clicking on this button will change the general look of the dashboard and you will notice a general resize border around all widgets.

Once you are in edit mode, you are free to move around and resize each widget at will.
By moving your mouse over the widget title area, you will also notice two additional commands appearing: one shaped like a cog and one like a trashcan. The first one will let you configure additional parameters of the widget while the second one will let you remove the widget from the current dashboard.
Widget Settings
Multiple settings are available for each Widget, depending on the contained data. The table below contains the complete list:
Data
Group Mode
This field will control how the data is grouped together. If No Grouping is selected, each record will be treated as a single entry.
Data
Filter Bots
Use this field to select a specific bot to filter your data. By default, the data of all your bots is used.
Data
Filter Channels
This field will activate a filter for a specific channel. By default all channels are used.
Data
Goal
The goal that should be displayed by this widget. This selection is mandatory.
Time
Period
Specify the time period for your data selection. Select custom to specify a date which is not in the pre-defined periods.
Time
Time Frame
This field indicates the way the data will be grouped on the time axis. Depending on the selected Period a smaller or greater time frame may be more suitable for your data.
Layout
Title
The title you want for your widget. You can clear the field if you do not want any title
Layout
Display Chart Legend
Will show or hide the chart legend. Not all charts can display a legend zone.
Add New Visualization
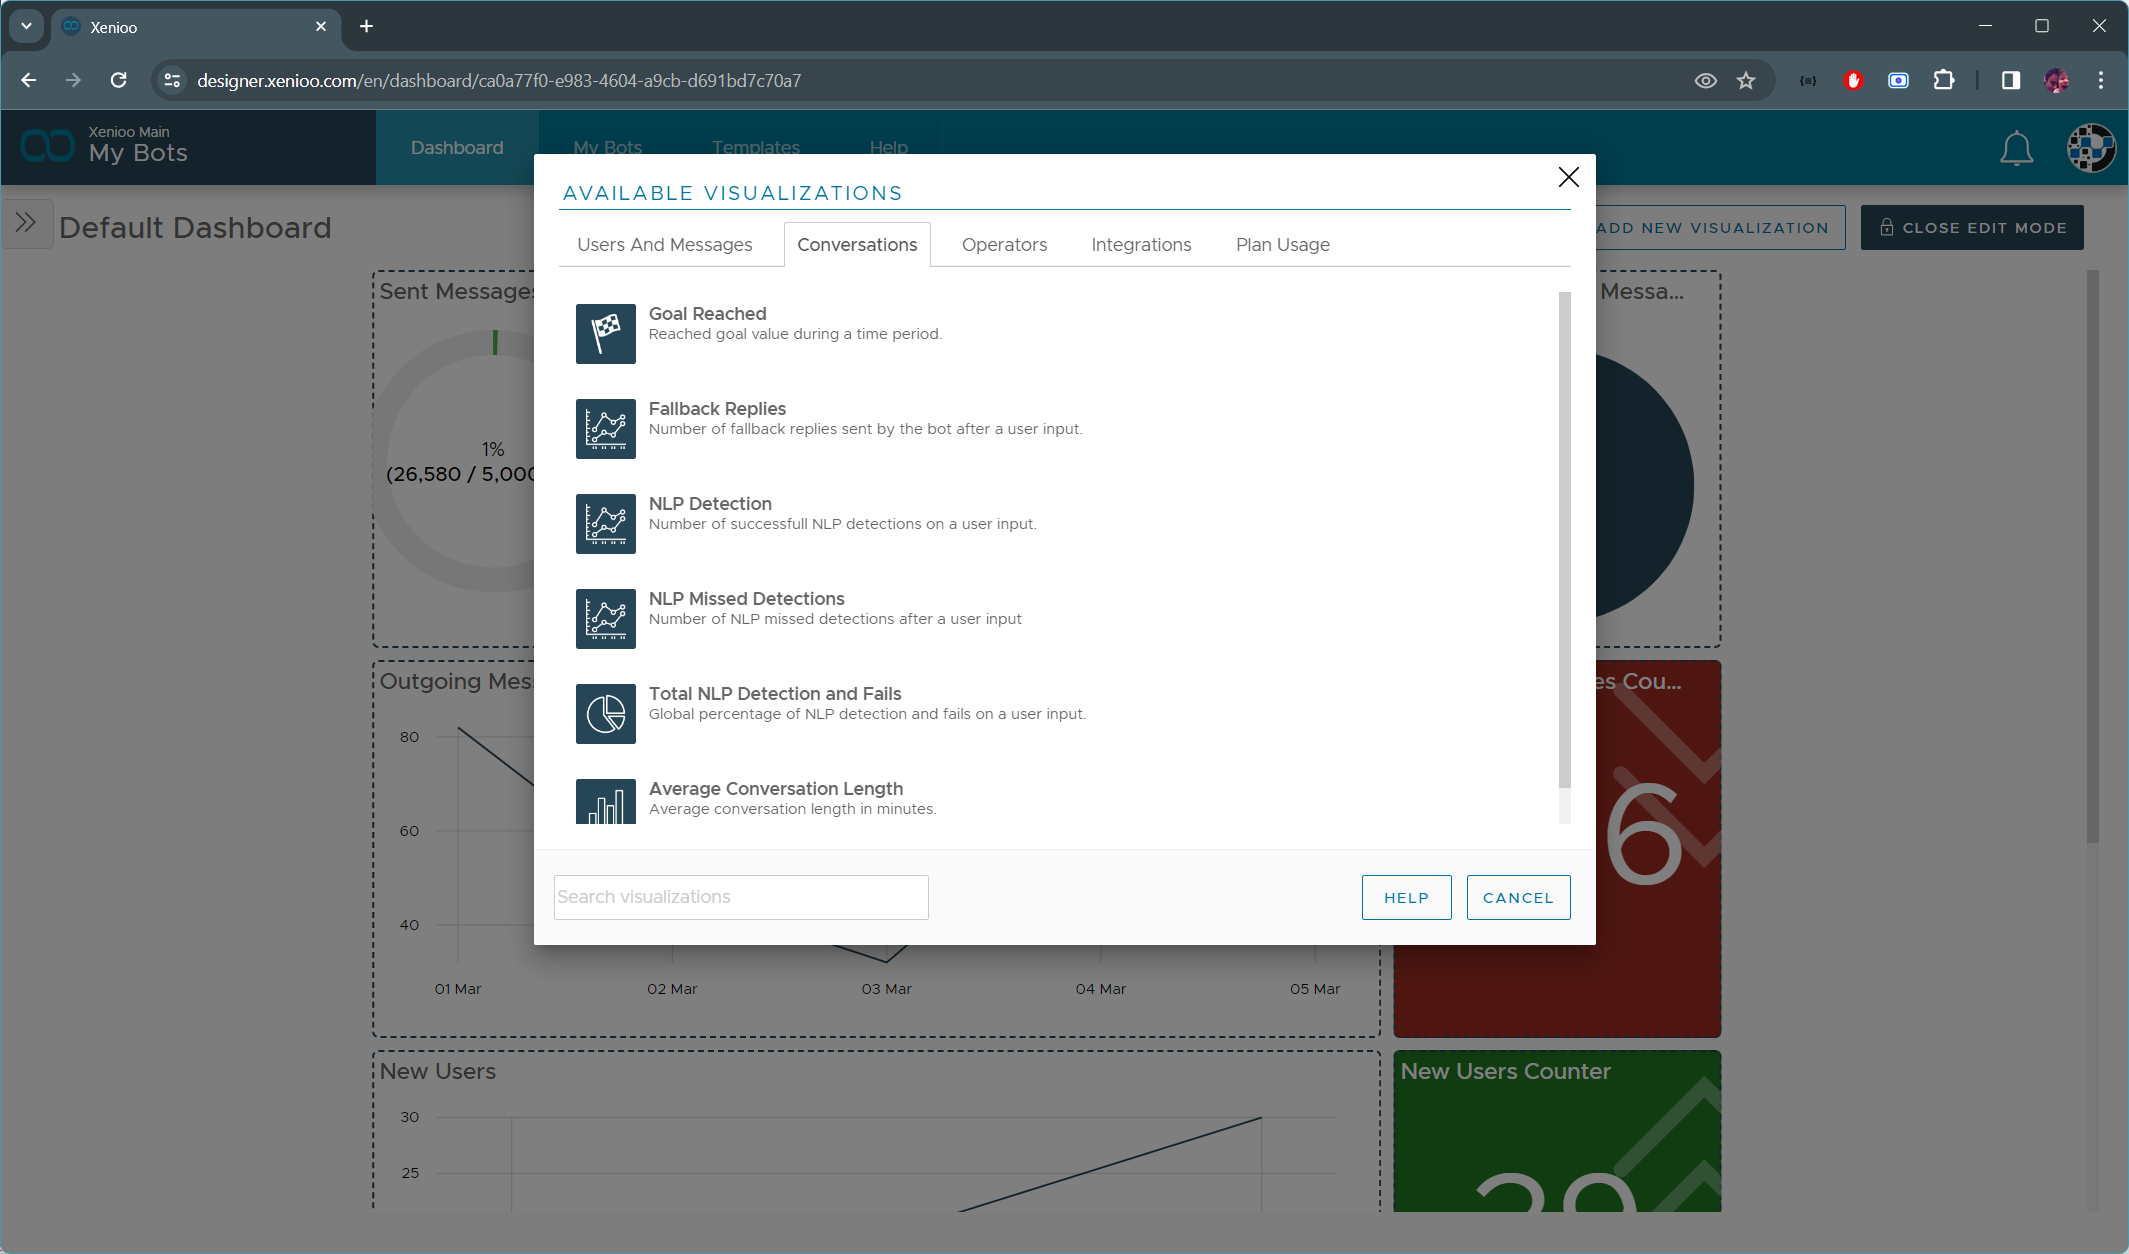
The Add New Visualization button will display a visualizations selector that will let you select one of the additional visualizations available.

You can add as many visualizations as you like to your dashboard. Even multiple widgets of the very same type are supported.
Create Additional Dashboards
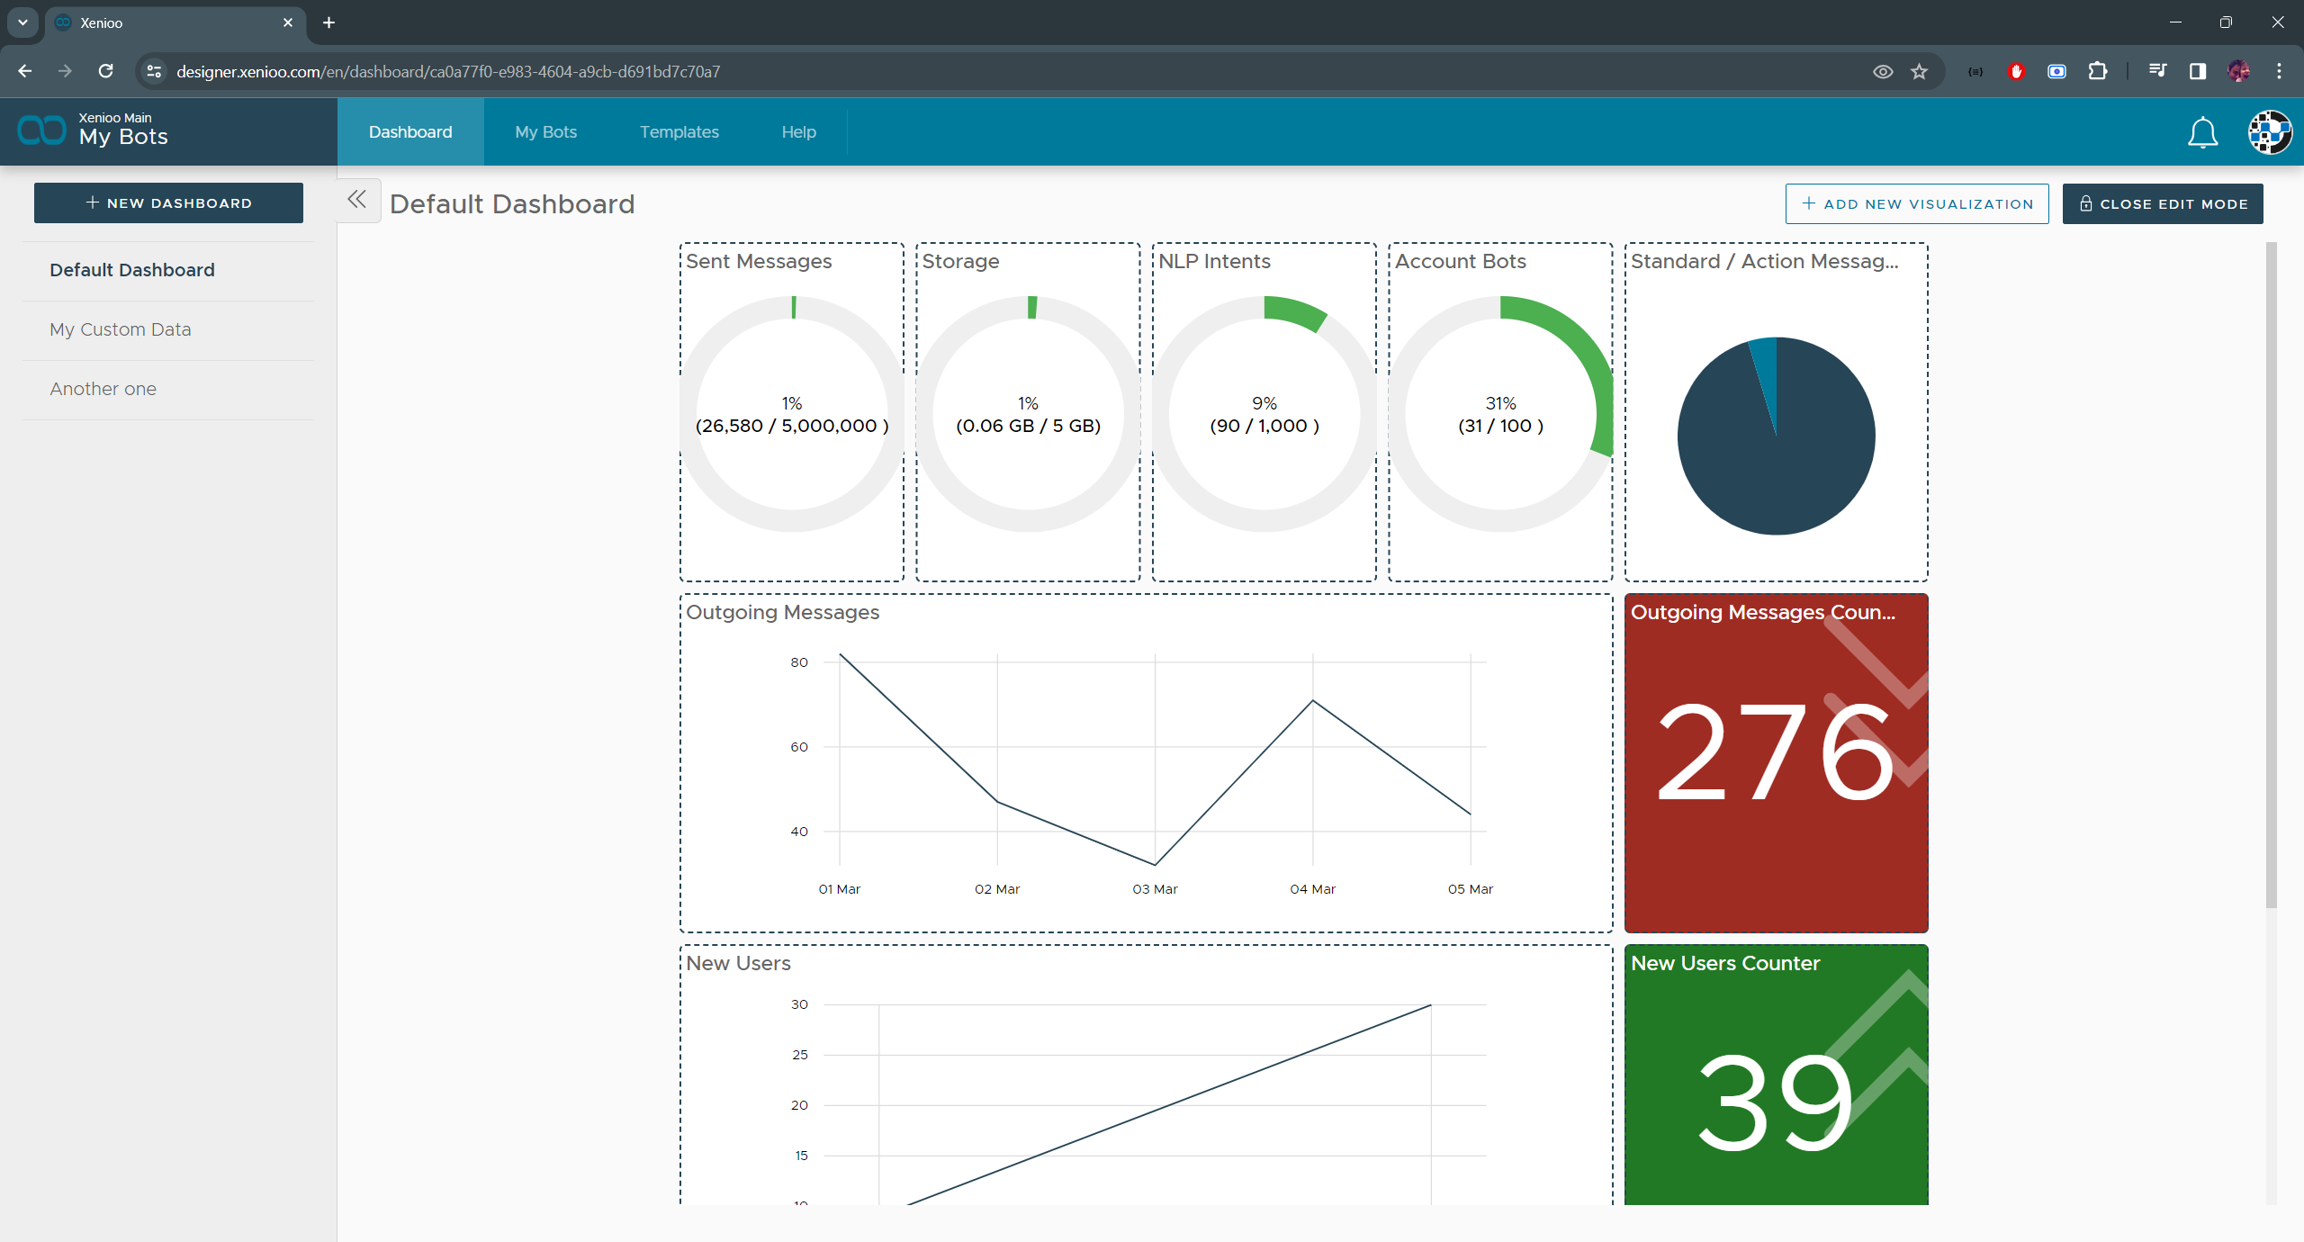
You're free to add more dashboards beside the default one. To add a new dashboard, click the arrow button on the left of you current dashboard title to open your dashboards drawer panel.
In the dashboards panel you'll see the full list of your custom dashboards and you will be able to create new ones by simply clicking on the "New Dashboard" button. New dashboards are created completely empty and ready to be customized.

You can edit and remove your dashboards anytime by using the edit and delete button that are visible by hovering on a dashboard entry. You're free to delete all dashboards but the last one.
Last updated